Maximilian Schich has created a video showing patterns in cultural migration across hundreds of years by showing the places of birth and death of notable individuals. Places of birth are shown in blue while places of death are shown in red.
The commentary for the video indicates that migration in France has been towards a single hub (Paris) whereas migration in Germany has been to several competing hubs (see around 2:00 in the video). The UK is not mentioned in the commentary but London is clearly shown as the dominant migration hub in the UK.
This level of centralisation can become unhealthy both for the rest of the country and for the hub itself. It is normally the young and energetic who look most widely for better opportunities. For the rest of the country, the continuous loss of economic energy can lead to alienation from the hub and even, as in Scotland today, to referenda on independence from the hub. For the hub itself, it can lead to problems of success such as overcrowding. For example, the ten most overcrowded train services in England and Wales all involve journeys to or through London.
The relative success of Germany compared with France and the UK might suggest at least the possibility that a country dominated by a single migration mega-hub is far from the optimal design.
Showing posts with label data visualisation. Show all posts
Showing posts with label data visualisation. Show all posts
18 September 2014

01 December 2012
30 October 2012
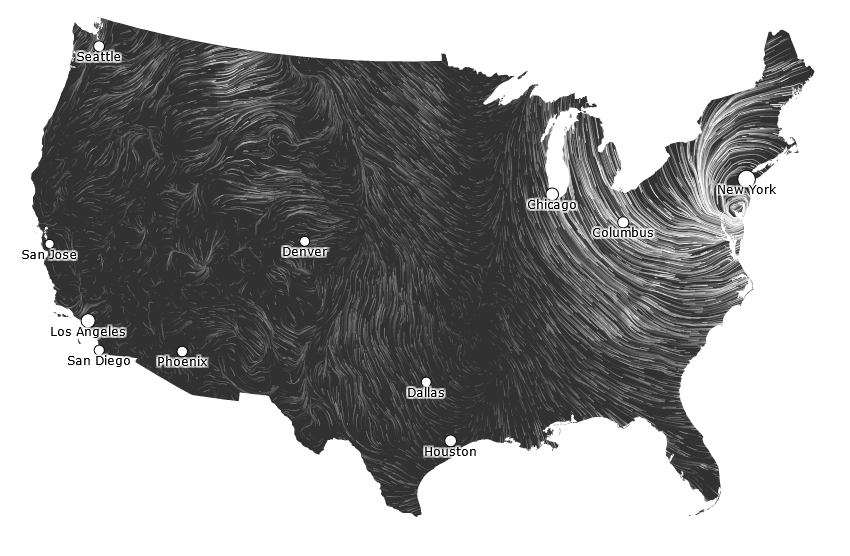
10 October 2012
Flight patterns and Johnny Cash
Aaron Koblin (and here) uses large and complex sets of data to create great visualisations. His work includes visual representations of flight patterns in the US, communications between New York and other cities, and SMS messages in Amsterdam.
Aaron has also helped to create a number of innovative and data-based music videos including House of Cards (for Radiohead), The Wilderness Downtown (for Arcade Fire), and The Johnny Cash Project. In the latter two projects, he collaborated with Chris Milk.
Watch Aaron talk about his work in a TED talk below.
Aaron has also helped to create a number of innovative and data-based music videos including House of Cards (for Radiohead), The Wilderness Downtown (for Arcade Fire), and The Johnny Cash Project. In the latter two projects, he collaborated with Chris Milk.
Watch Aaron talk about his work in a TED talk below.
26 September 2012
Evolution of the wealth of nations
One of the biggest tensions in economics is between a top-down macro view of the economy and a bottom-up micro view of the economy. César Hidalgo (and here) is pursuing a very visual and data oriented approach to economic thinking which allows him to get the best of both worlds.
César talks about his work here. The Observatory of Economic Complexity is here. His TED talk from 2010 is also very interesting. Watch his TED talk after the jump. It's all about lego and putty.
| We have always had this tension of understanding the world, at small spatial scales or individual scales, and large macro scales. In the past when we looked at macro scales, at least when it comes to many social phenomena, we aggregated everything. Our idea of macro is, by an accident of history, a synonym of aggregate, a mass in which everything is added up and in which individuality is lost. What data at high spatial resolution, temporal resolution and typological resolution is allowing us to do, is to see the big picture without losing the individuality inside it. I believe that in the future, macro is going to be something that is going to be in high-definition. You're going to be able to zoom in into these macro pictures and see that neighborhood, and see that person, and understand that individual, and to have more personalized interactions thanks to the data that is becoming available. I think that in some sense, big data can help recover the humanity of a world in which the scientific representations of people have become dehumanized, because of our need to simplify. |
|---|
| César Hidalgo |
César talks about his work here. The Observatory of Economic Complexity is here. His TED talk from 2010 is also very interesting. Watch his TED talk after the jump. It's all about lego and putty.
29 March 2012
A broader perspective
Before we get embroiled in the detail of the current economic crisis, it’s worth taking a step back and looking at our economic well-being from a broader perspective.
We could look at our place in the scale of the universe (awesome animation) but that might be taking perspective too far. Let’s consider the last 200 years.
Our individual and collective well-being has increased dramatically since the Industrial Revolution. Health and longevity have increased dramatically. Wealth has increased dramatically. This has occurred in almost all countries – irrespective of specific political and economic ideologies – albeit at different rates and at different times.
In 1989, at the time of the fall of the Berlin Wall, Free Market Capitalism was thought to have vanquished Communism. Intellectuals wrote books proclaiming The End of History. However, a mere twenty years later, Communist China has one of the fastest growing economies and is predicted to become the biggest economy in the world by mid-century.

In the BBC programme, The Joy of Stats, Hans Rosling presented a superb four minute visualisation of the history of economic well-being across 200 years and 200 countries.
You can find out more about Han Rosling's work at Gapminder.
Watch 200 countries, 200 years, 4 minutes after the jump. Also, a longer TED talk by Hans Rosling with further economic data visualisation.
We could look at our place in the scale of the universe (awesome animation) but that might be taking perspective too far. Let’s consider the last 200 years.
Our individual and collective well-being has increased dramatically since the Industrial Revolution. Health and longevity have increased dramatically. Wealth has increased dramatically. This has occurred in almost all countries – irrespective of specific political and economic ideologies – albeit at different rates and at different times.
In 1989, at the time of the fall of the Berlin Wall, Free Market Capitalism was thought to have vanquished Communism. Intellectuals wrote books proclaiming The End of History. However, a mere twenty years later, Communist China has one of the fastest growing economies and is predicted to become the biggest economy in the world by mid-century.

The Joy of Stats
In the BBC programme, The Joy of Stats, Hans Rosling presented a superb four minute visualisation of the history of economic well-being across 200 years and 200 countries.
You can find out more about Han Rosling's work at Gapminder.
Watch 200 countries, 200 years, 4 minutes after the jump. Also, a longer TED talk by Hans Rosling with further economic data visualisation.
Subscribe to:
Posts (Atom)